Every cluster has a centroid (i.e. average start time and duration) that can be related to a daily human behaviour or connection pattern (e.g. Worktime, Dinner, etc.). In this function, a user profile name is assigned to every cluster.
Arguments
- models
tibble, parameters of the clusters' GMM models obtained with function
cluster_sessions()(objectmodelsof the returned list)- interpretations
character vector with interpretation sentences of each cluster (arranged by cluster number)
- profile_names
character vector with user profile assigned to each cluster (arranged by cluster number)
- log
logical, whether to transform
ConnectionStartDateTimeandConnectionHoursvariables to natural logarithmic scale (base =exp(1)).
Examples
library(dplyr)
# Select working day sessions (`Timecycle == 1`) that
# disconnect the same day (`Disconnection == 1`)
sessions_day <- california_ev_sessions %>%
divide_by_timecycle(
months_cycles = list(1:12), # Not differentiation between months
wdays_cycles = list(1:5, 6:7) # Differentiation between workdays/weekends
) %>%
divide_by_disconnection(
division_hour = 10, start = 3
) %>%
filter(
Disconnection == 1, Timecycle == 1
) %>%
sample_frac(0.05)
#> The considered time-cycles are:
#>
#>
#> |Timecycle |months |wdays |
#> |:---------|:------|:-----|
#> |1 |1-12 |1-5 |
#> |2 |1-12 |6-7 |
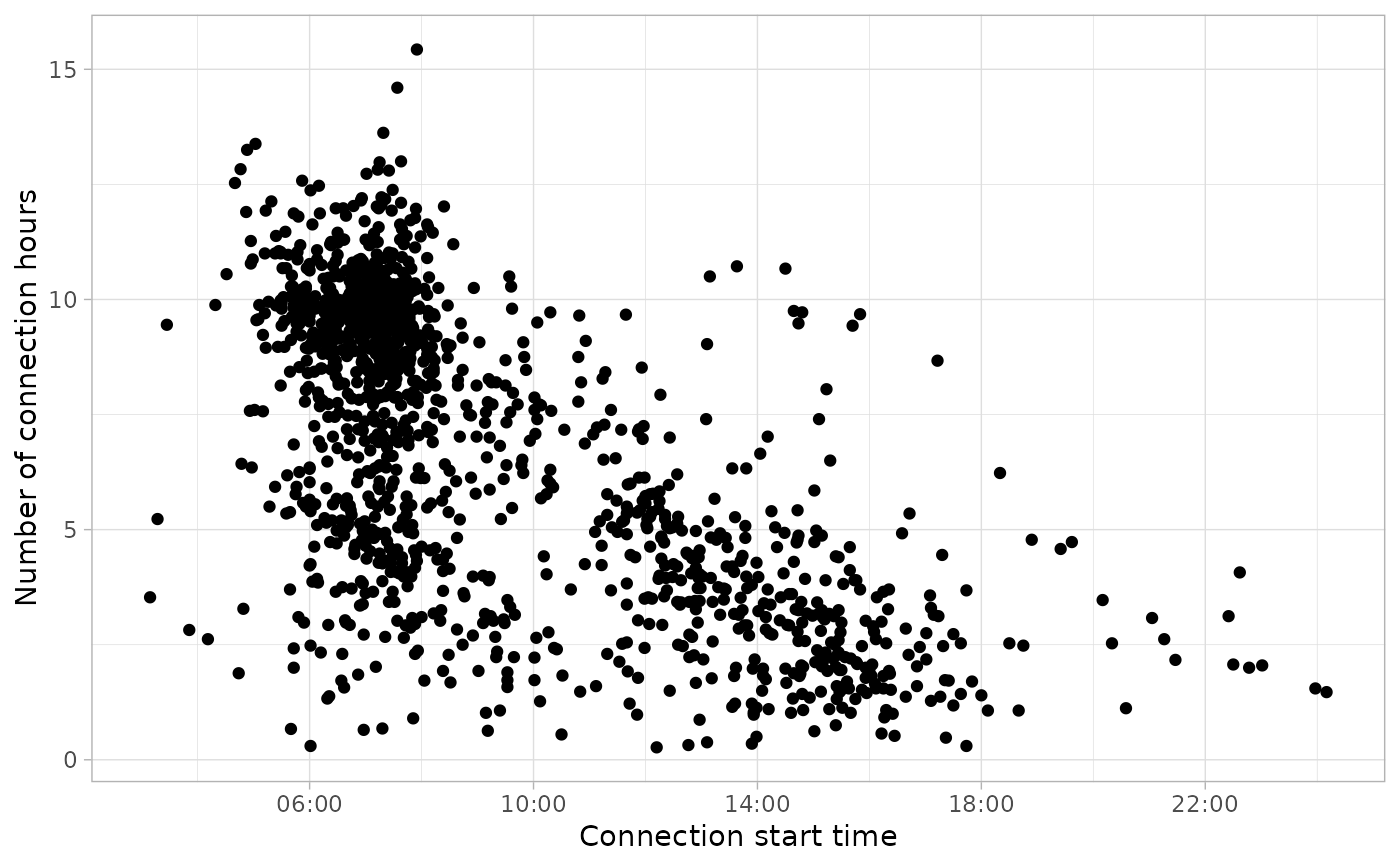
plot_points(sessions_day, start = 3)
 # Identify two clusters
sessions_clusters <- cluster_sessions(
sessions_day, k=2, seed = 1234, log = TRUE
)
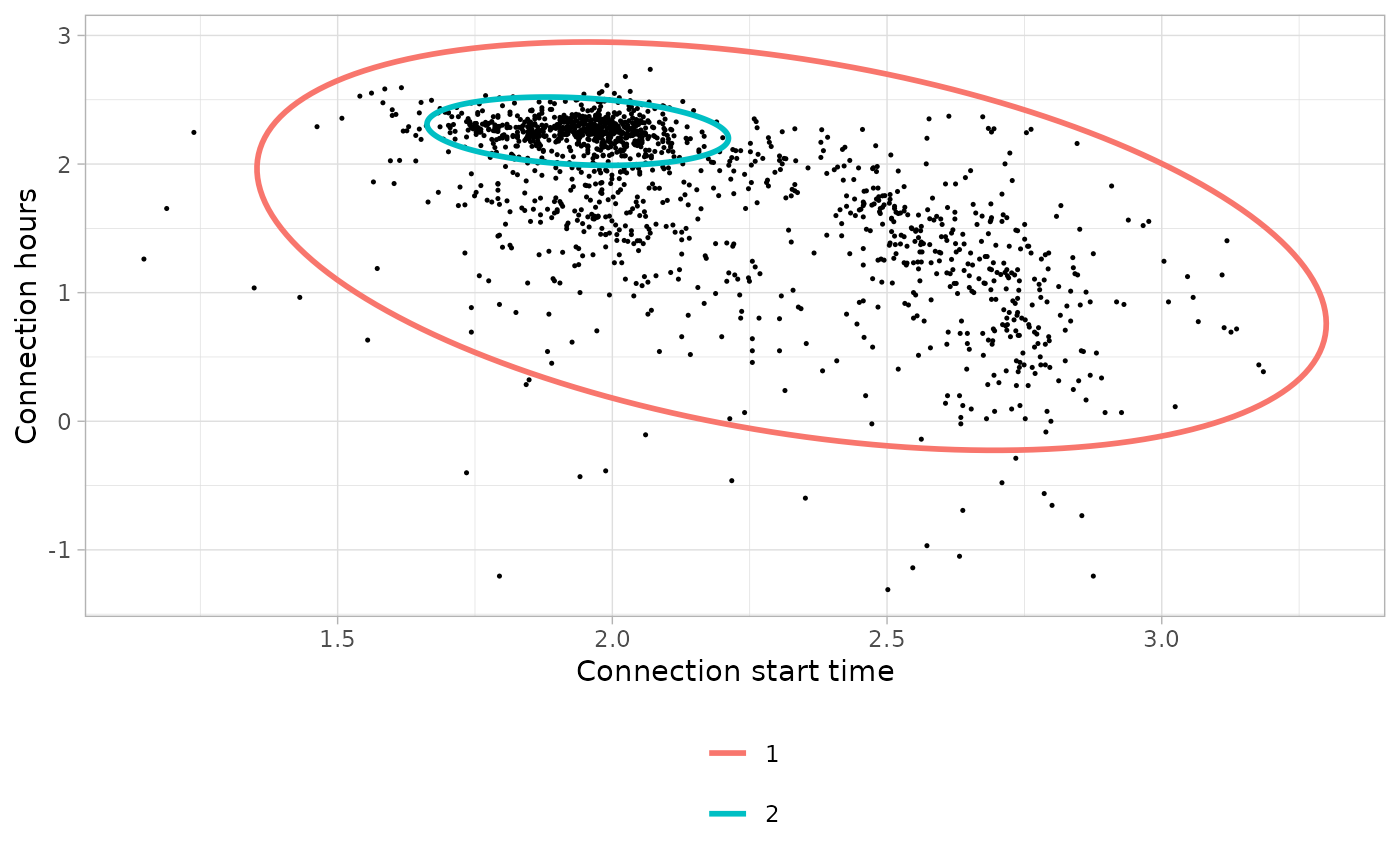
# Plot the clusters found
plot_bivarGMM(
sessions = sessions_clusters$sessions,
models = sessions_clusters$models,
log = TRUE, start = 3
)
# Identify two clusters
sessions_clusters <- cluster_sessions(
sessions_day, k=2, seed = 1234, log = TRUE
)
# Plot the clusters found
plot_bivarGMM(
sessions = sessions_clusters$sessions,
models = sessions_clusters$models,
log = TRUE, start = 3
)
 # Define the clusters with user profile interpretations
define_clusters(
models = sessions_clusters$models,
interpretations = c(
"Connections during working hours",
"Connections during all day (high variability)"
),
profile_names = c("Workers", "Visitors"),
log = TRUE
)
#> # A tibble: 2 × 5
#> cluster mean_start_time mean_conn_time interpretations profile
#> <chr> <chr> <dbl> <chr> <chr>
#> 1 1 10:14 3.90 Connections during working hou… Workers
#> 2 2 06:56 9.54 Connections during all day (hi… Visito…
# Define the clusters with user profile interpretations
define_clusters(
models = sessions_clusters$models,
interpretations = c(
"Connections during working hours",
"Connections during all day (high variability)"
),
profile_names = c("Workers", "Visitors"),
log = TRUE
)
#> # A tibble: 2 × 5
#> cluster mean_start_time mean_conn_time interpretations profile
#> <chr> <chr> <dbl> <chr> <chr>
#> 1 1 10:14 3.90 Connections during working hou… Workers
#> 2 2 06:56 9.54 Connections during all day (hi… Visito…