Scatter plot of sessions
Usage
plot_points(sessions, start = getOption("evprof.start.hour"), log = FALSE, ...)Arguments
- sessions
tibble, sessions data set in evprof standard format
- start
integer, start hour in the x axis of the plot.
- log
logical, whether to transform
ConnectionStartDateTimeandConnectionHoursvariables to natural logarithmic scale (base =exp(1)).- ...
arguments to
ggplot2::geom_pointfunction
Examples
library(dplyr)
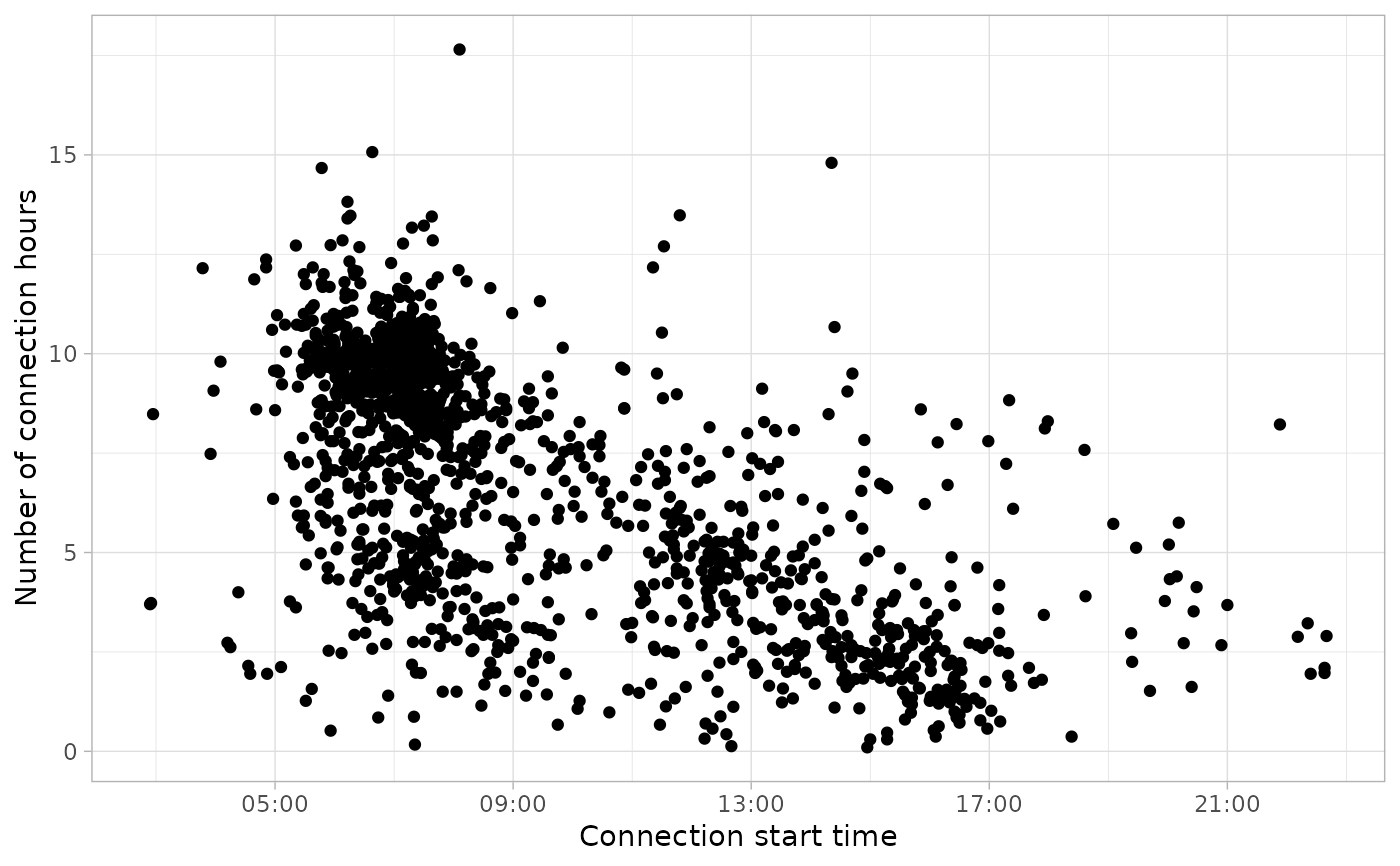
california_ev_sessions %>%
  sample_frac(0.05) %>%
  plot_points()

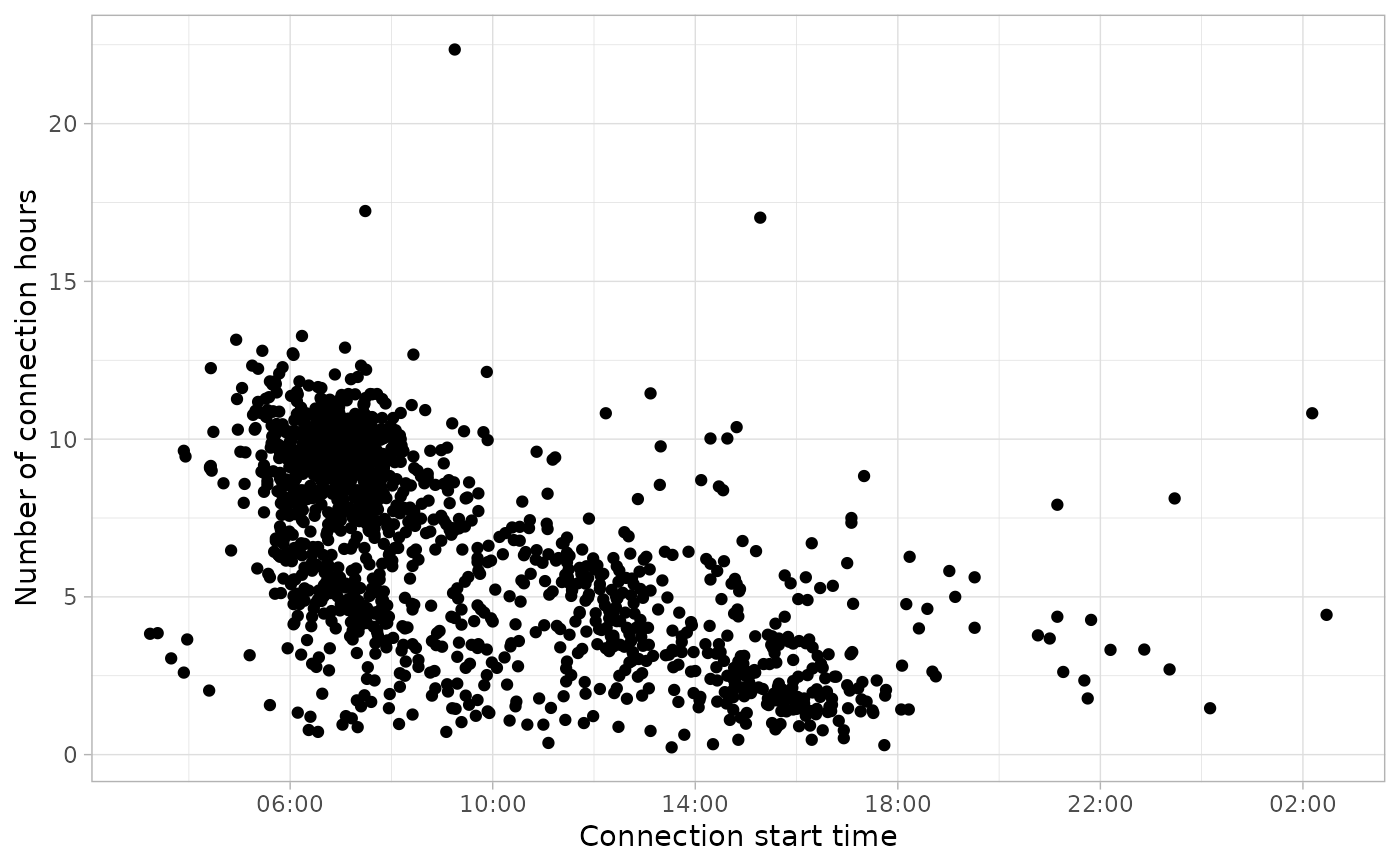
california_ev_sessions %>%
  sample_frac(0.05) %>%
  plot_points(start = 3)

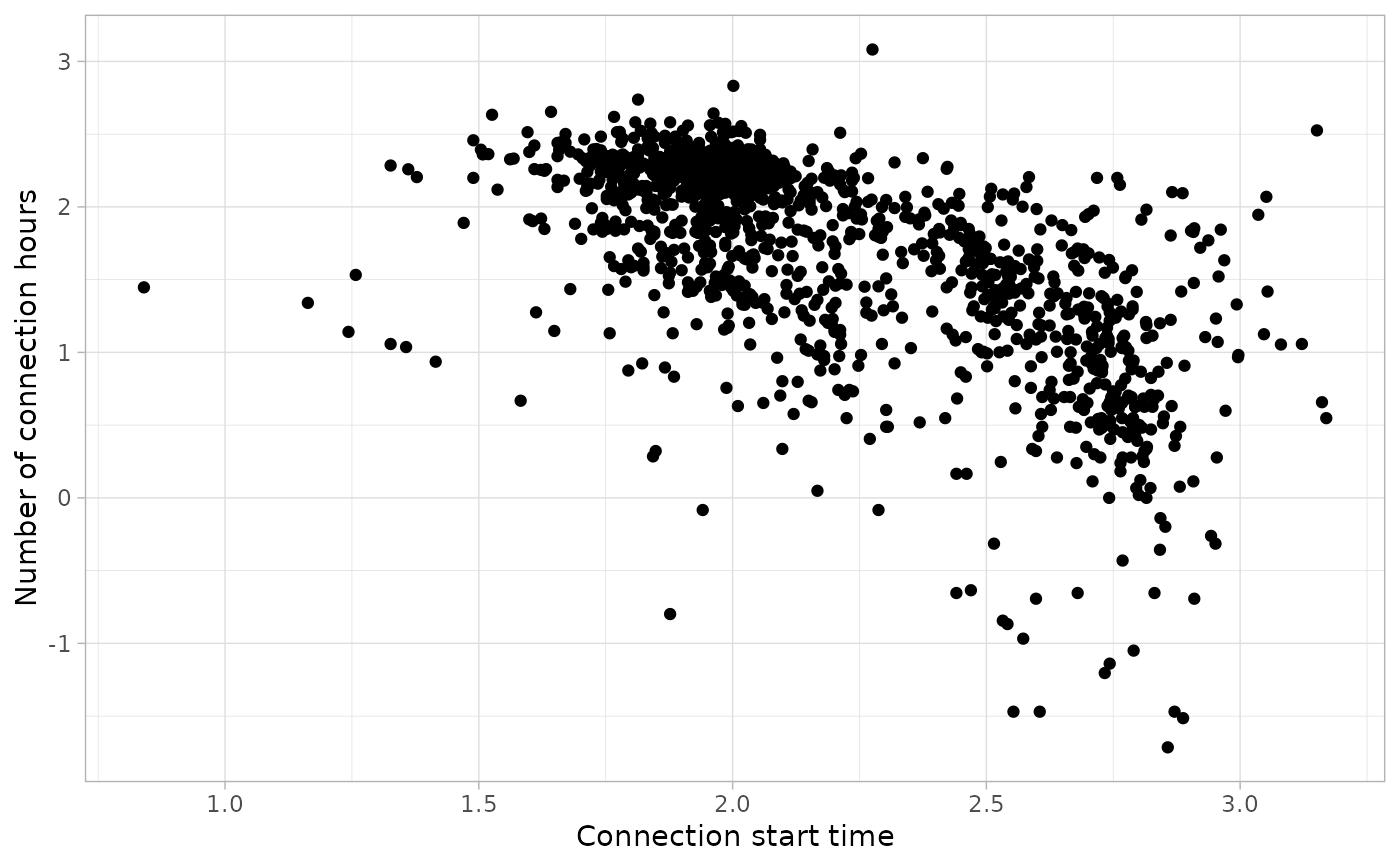
california_ev_sessions %>%
  sample_frac(0.05) %>%
  plot_points(log = TRUE)

