Cluster sessions with mclust package
Usage
cluster_sessions(
  sessions,
  k,
  seed,
  mclust_tol = 1e-08,
  mclust_itmax = 10000,
  log = FALSE,
  start = getOption("evprof.start.hour")
)
Arguments
- sessions
tibble, sessions data set in evprof standard format
- k
number of clusters
- seed
random seed
- mclust_tol
tolerance parameter for clustering
- mclust_itmax
maximum number of iterations
- log
logical, whether to transform
ConnectionStartDateTimeandConnectionHoursvariables to natural logarithmic scale (base =exp(1)).- start
integer, start hour in the x axis of the plot.
Examples
library(dplyr)
#>
#> Attaching package: ‘dplyr’
#> The following objects are masked from ‘package:stats’:
#>
#> filter, lag
#> The following objects are masked from ‘package:base’:
#>
#> intersect, setdiff, setequal, union
# Select working day sessions (`Timecycle == 1`) that
# disconnect the same day (`Disconnection == 1`)
sessions_day <- california_ev_sessions %>%
divide_by_timecycle(
months_cycles = list(1:12), # Not differentiation between months
wdays_cycles = list(1:5, 6:7) # Differentiation between workdays/weekends
) %>%
divide_by_disconnection(
division_hour = 10, start = 3
) %>%
filter(
Disconnection == 1, Timecycle == 1
) %>%
sample_frac(0.05)
#> The considered time-cycles are:
#>
#>
#> |Timecycle |months |wdays |
#> |:---------|:------|:-----|
#> |1 |1-12 |1-5 |
#> |2 |1-12 |6-7 |
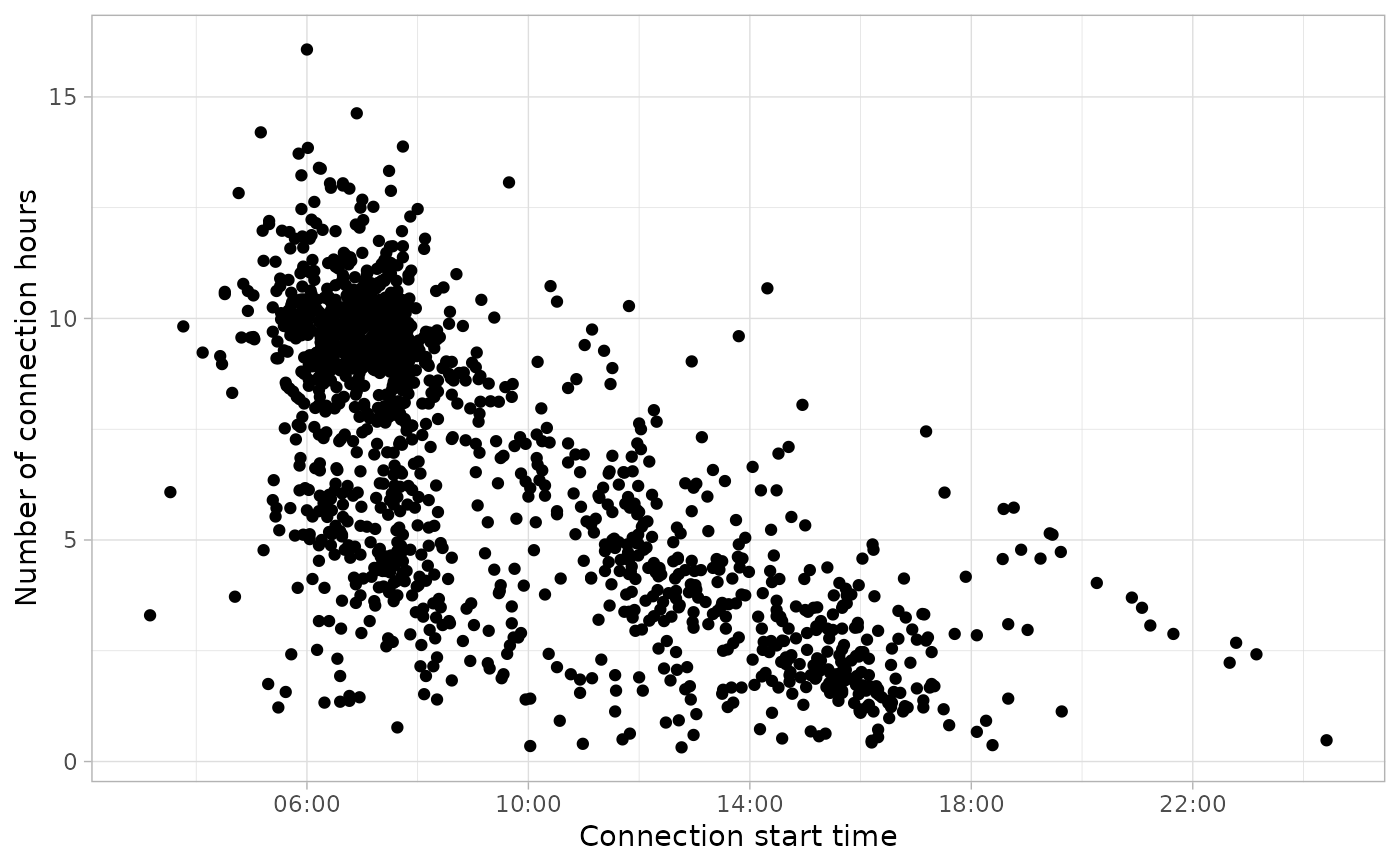
plot_points(sessions_day, start = 3)
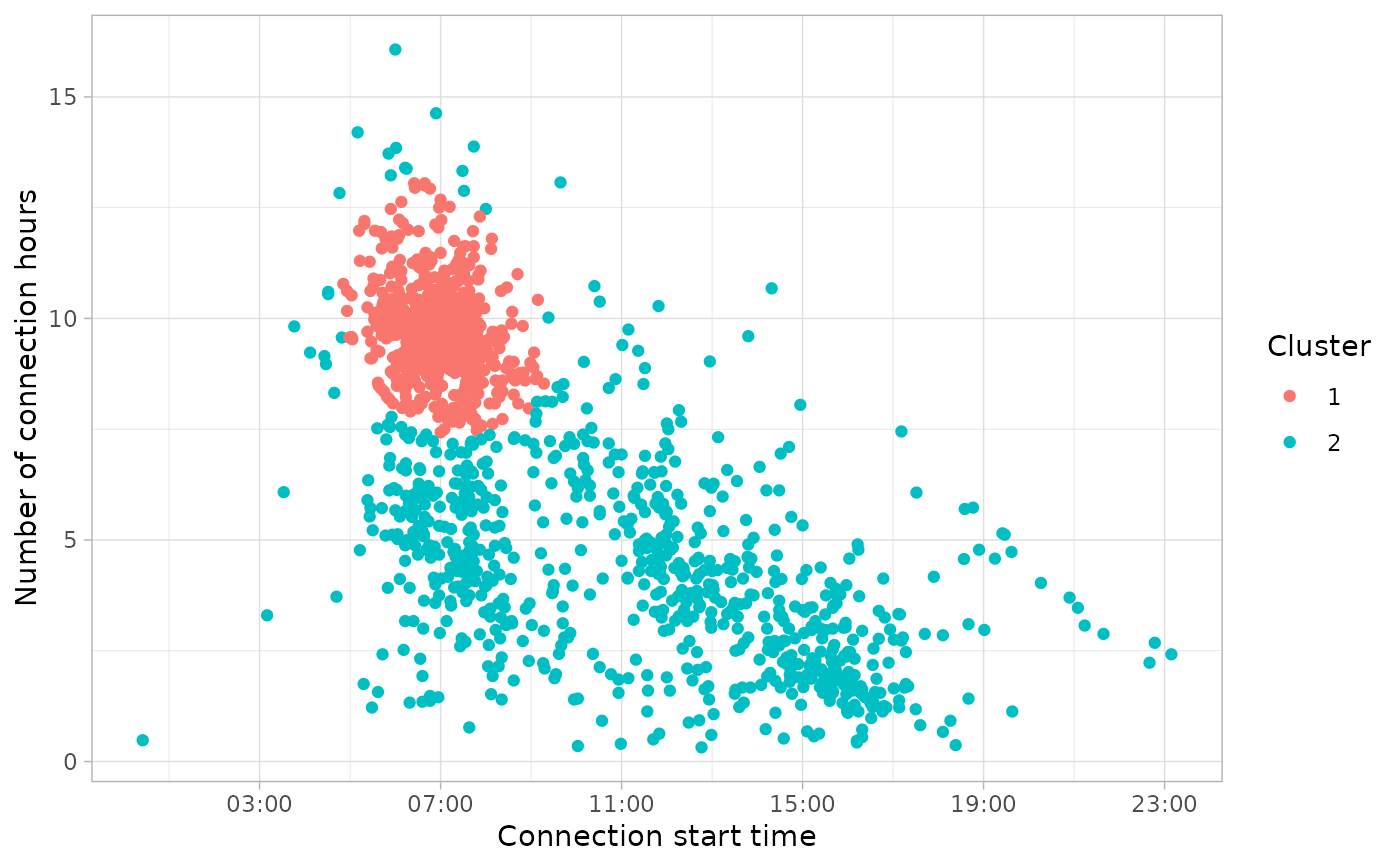
 # Identify two clusters
sessions_clusters <- cluster_sessions(
sessions_day, k=2, seed = 1234, log = TRUE
)
# The column `Cluster` has been added
names(sessions_clusters$sessions)
#> [1] "Session" "ConnectionStartDateTime"
#> [3] "ConnectionEndDateTime" "ChargingStartDateTime"
#> [5] "ChargingEndDateTime" "Power"
#> [7] "Energy" "ConnectionHours"
#> [9] "ChargingHours" "FlexibilityHours"
#> [11] "ChargingStation" "UserID"
#> [13] "Timecycle" "Disconnection"
#> [15] "Cluster"
plot_points(sessions_clusters$sessions) +
ggplot2::aes(color = Cluster)
# Identify two clusters
sessions_clusters <- cluster_sessions(
sessions_day, k=2, seed = 1234, log = TRUE
)
# The column `Cluster` has been added
names(sessions_clusters$sessions)
#> [1] "Session" "ConnectionStartDateTime"
#> [3] "ConnectionEndDateTime" "ChargingStartDateTime"
#> [5] "ChargingEndDateTime" "Power"
#> [7] "Energy" "ConnectionHours"
#> [9] "ChargingHours" "FlexibilityHours"
#> [11] "ChargingStation" "UserID"
#> [13] "Timecycle" "Disconnection"
#> [15] "Cluster"
plot_points(sessions_clusters$sessions) +
ggplot2::aes(color = Cluster)