Iteration over evprof::plot_division_line function to plot multiple lines
Source:R/preprocessing.R
plot_division_lines.RdIteration over evprof::plot_division_line function to plot multiple lines
Examples
library(dplyr)
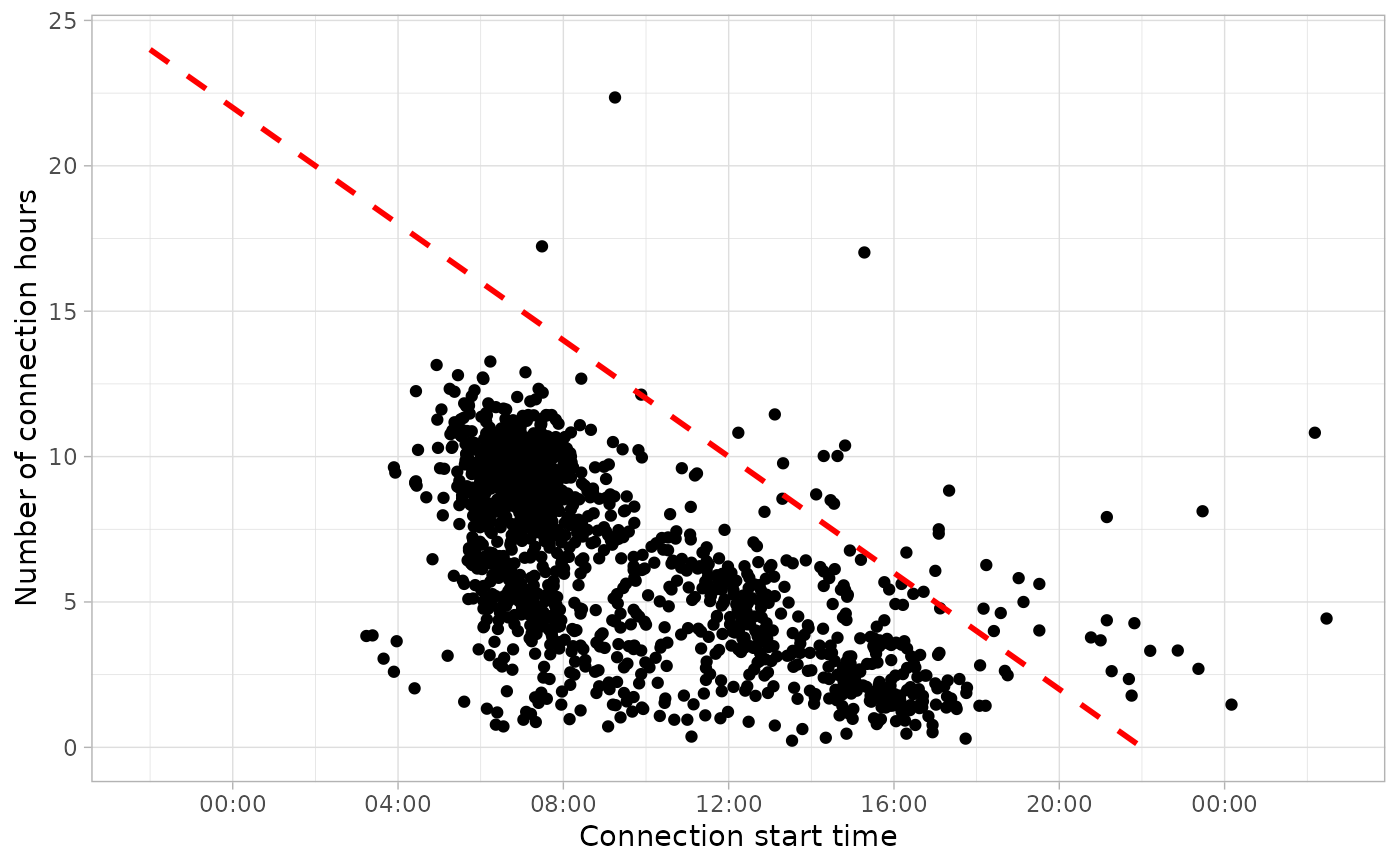
california_ev_sessions %>%
sample_frac(0.05) %>%
plot_points(start = 3) %>%
plot_division_lines(n_lines = 1, division_hour = 5)