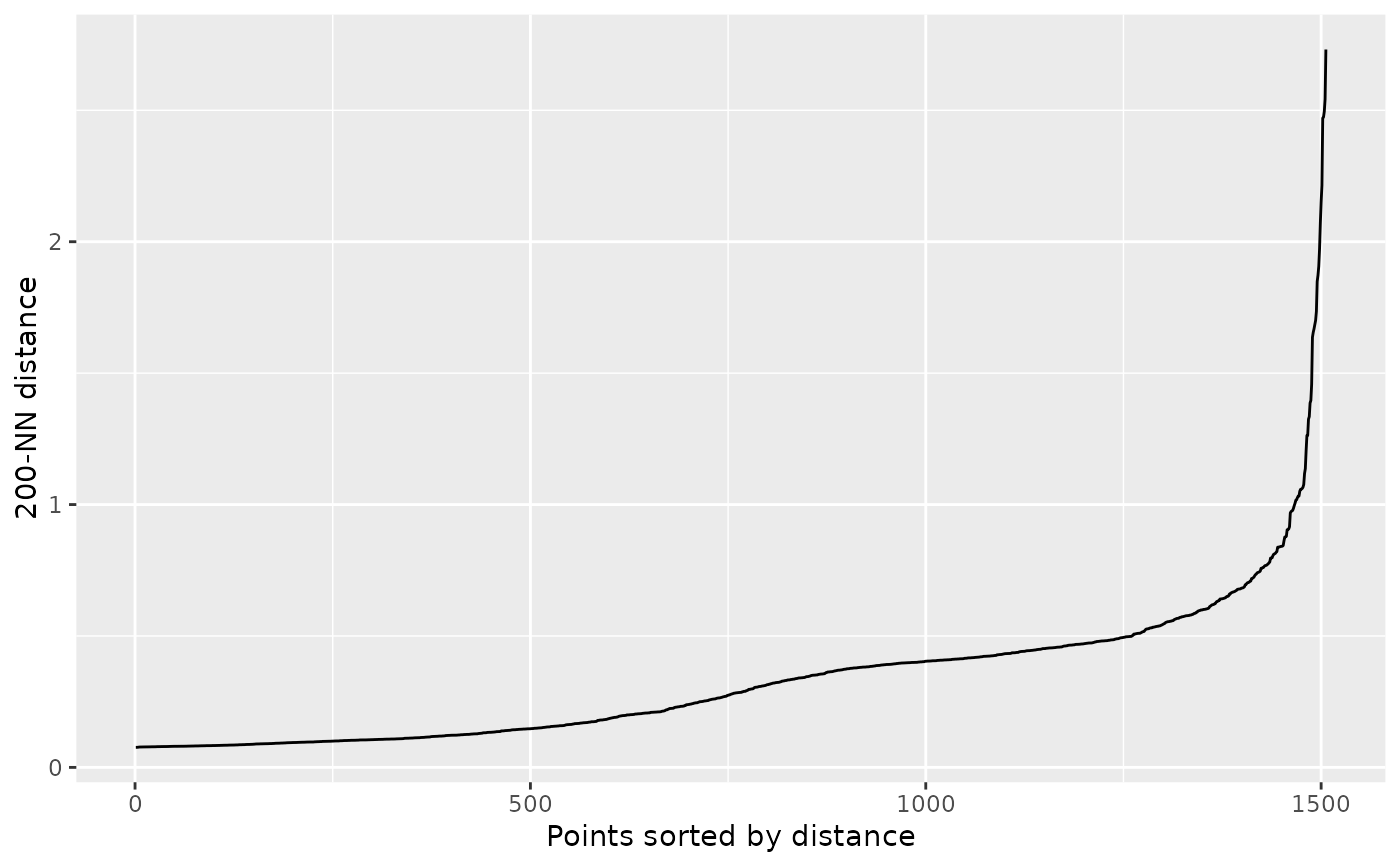
Plot the kNN (k-nearest neighbors) distance plot to visually detect the
"elbow" and define an appropriate value for eps DBSCAN parameter.
Usage
plot_kNNdist(
  sessions,
  MinPts = NULL,
  log = FALSE,
  start = getOption("evprof.start.hour")
)
Arguments
- sessions
tibble, sessions data set in evprof standard format
- MinPts
integer, DBSCAN MinPts parameter. If null, a value of 200 will be considered.
- log
logical, whether to transform
ConnectionStartDateTimeandConnectionHoursvariables to natural logarithmic scale (base =exp(1)).- start
integer, start hour in the x axis of the plot.
Details
The kNN (k-nearest neighbors) distance plot can provide insights into
setting the eps parameter in DBSCAN. The "elbow" in the kNN distance plot
is the point where the distances start to increase significantly. At the
same time, for DBSCAN, the eps parameter defines the radius within which a
specified number of points must exist for a data point to be considered a
core point. Therefore, the "elbow" of the kNN distance plot can provide a
sense of the scale of the data and help you choose a reasonable range for
the eps parameter in DBSCAN.
Examples
library(dplyr)
california_ev_sessions %>%
  sample_frac(0.05) %>%
  plot_kNNdist(start = 3, log = TRUE)

