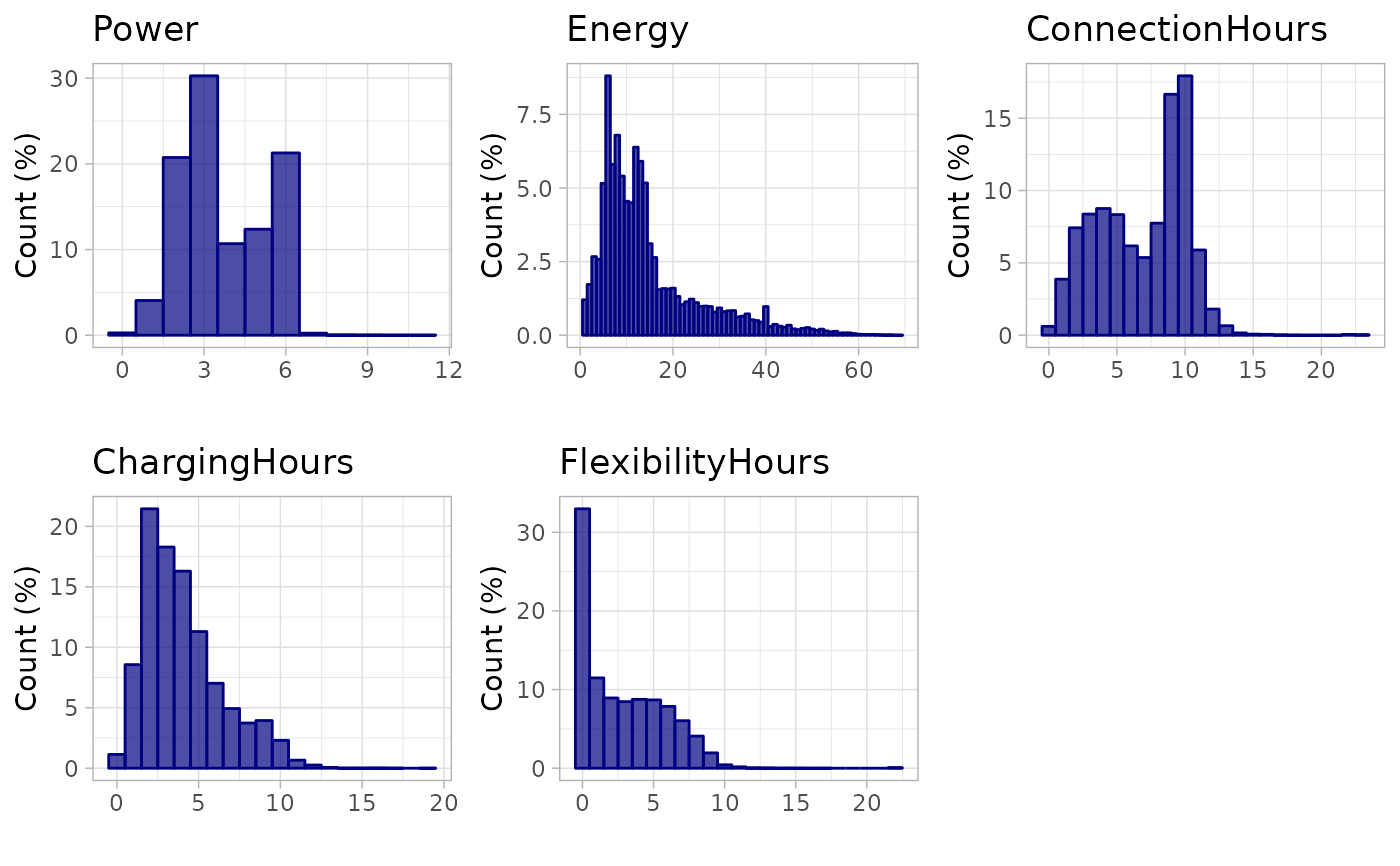
Grid of multiple variable histograms
Usage
plot_histogram_grid(
  sessions,
  vars = evprof::sessions_summary_feature_names,
  binwidths = rep(1, length(vars)),
  nrow = NULL,
  ncol = NULL
)
Arguments
- sessions
tibble, sessions data set in evprof standard format
- vars
vector of characters, variables to plot
- binwidths
vector of integers, binwidths of each variable histogram. The length of the vector must correspond to the length of the
varsparameter.- nrow
integer, number of rows of the plot grid
- ncol
integer, number of columns of the plot grid
Examples
plot_histogram_grid(california_ev_sessions)

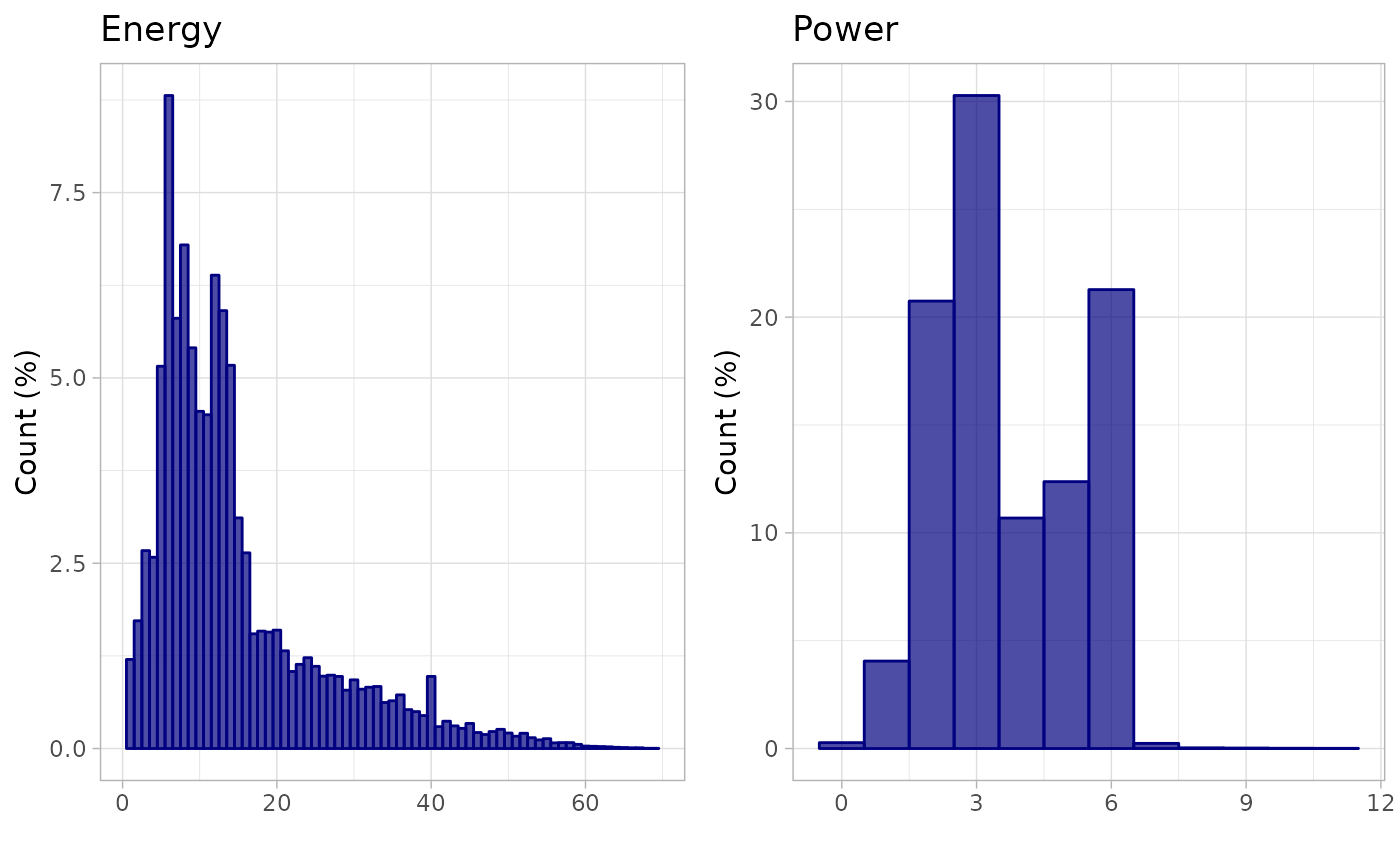
plot_histogram_grid(california_ev_sessions, vars = c("Energy", "Power"))

